Toggle Element State with Google Chrome and Mozilla Firefox
It's much easier to debug CSS than JavaScript since there are many fewer interactions in CSS, and they are much easier emulate. Still, element state debugging isn't simple...until now. Google Chrome's WebInspector and Mozilla Firefox's Firebug have a really sweet feature I just discovered which allows the developer to apply element states for the sake of debugging.
Chrome's WebInspector
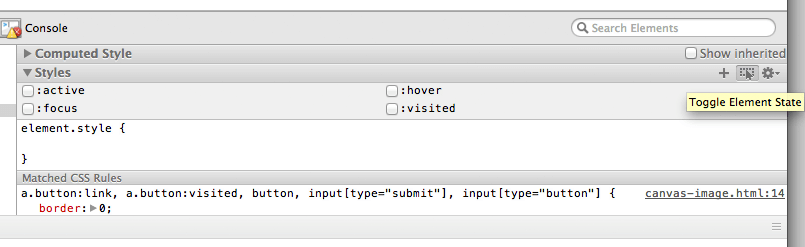
The image above displays Chrome's "Toggle Element State" button, allowing developers to toggle CSS states via checkboxes.
Firefox's Firebug
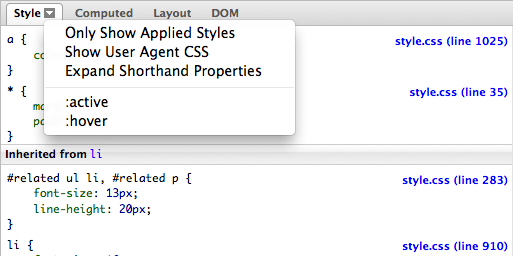
The image displays Firebug's likewise menu, triggered by the down arrow on the CSS tab for an element.
This allows active CSS state bugging vs. simple CSS explorations to be much, much easier. Happy CSS debugging!
![7 Essential JavaScript Functions]()
I remember the early days of JavaScript where you needed a simple function for just about everything because the browser vendors implemented features differently, and not just edge features, basic features, like addEventListener and attachEvent. Times have changed but there are still a few functions each developer should...
![5 Awesome New Mozilla Technologies You’ve Never Heard Of]()
My trip to Mozilla Summit 2013 was incredible. I've spent so much time focusing on my project that I had lost sight of all of the great work Mozillians were putting out. MozSummit provided the perfect reminder of how brilliant my colleagues are and how much...
![MooTools Clipboard Plugin]()
The ability to place content into a user's clipboard can be extremely convenient for the user. Instead of clicking and dragging down what could be a lengthy document, the user can copy the contents of a specific area by a single click of a mouse.
![Drag and Drop Z-Index Stacking]()


Great tip, thanks =)
FireBug does this for years. Just click the little arrow next to the style tab. It’s only
:hoverand:active, though.Awesome, just added that as well.
The only thing Chrome cant do with states is when I need to debug an element that matches selector
parentElement:hover element, for exampleChrome applies states only to selected element in inspector and when you selected another element, selected state is applied to new element
Next challenge: Debug pseudo elements with web inspector :p
the Chrome web inspector already supports pseudo elements.
Under the Matched CSS rules is a Psuedo element
I believe the latest version of firebug does similar, but I’m not sure as I haven’t used it in ages
Unfortunately you can not select the pseudo element like any other DOM-Element. Technically this is perfectly valid since pseudo-elements are not part of the DOM but I often miss that feature. Pseudo-elements are harder to debug than necessary.
Good stuff, from what I know this has been around for a while already.
@JAN BECK – not that hard really, you just have to select the main element and scroll down in the inspector panel to see the psuedo elements
it’s also possible to do this with Firefox’ built in developer tools :-)