How Hacker News Crushed David Walsh Blog
Earlier this month, David’s heartfelt posting about leaving Mozilla made the front page of Hacker News. Traffic increased by 800% to his already-busy website, which slowed and eventually failed under the pressure. Request Metrics monitors performance and uptime for David’s blog, and our metrics tell an interesting story. Here’s what happened, why, and what you can do to prepare your site for traffic surges.
DavidWalsh.name Technology
David’s site uses WordPress. It serves most content from a MySQL database, which is a well-known performance limitation. To mitigate this, David uses Cloudflare to cache the content of the site and reduce the load to his server.
Cloudflare does this by taking control of DNS and routing requests through their edge network before calling your server. When possible, Cloudflare will return cached content rather than needing to call your server at all, which is particularly useful when request volume goes way up. It’s even free for most websites, which is pretty awesome.
Monitoring the Spike
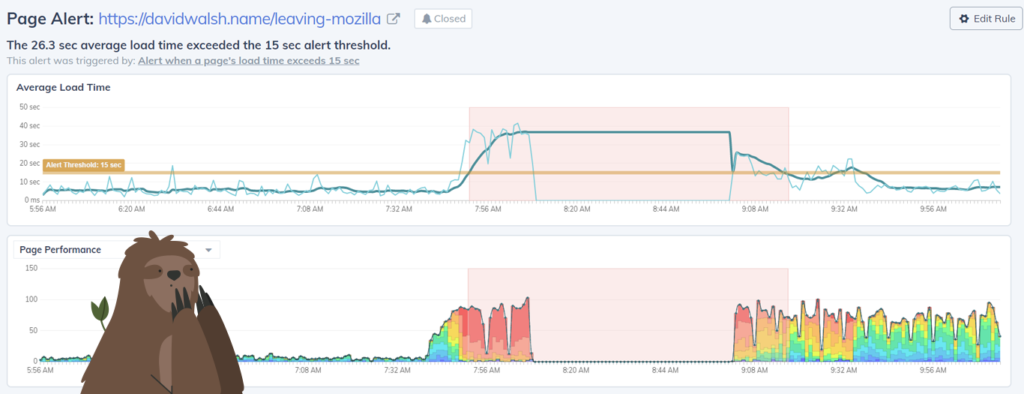
Traffic began to surge to the page around 7:40 AM (local time), and the system handled it in stride. The median page load was acceptable at 4-6 seconds.
By 7:50 AM, traffic hit the limit of the technology, around 100 page views per minute, and the user experience quickly degraded. Median page load times grew to more than 30 seconds. Unable to fulfill the requests, the site went down at around 8:10 and remained offline for about 40 minutes.
Here’s the alert that went off in Request Metrics:

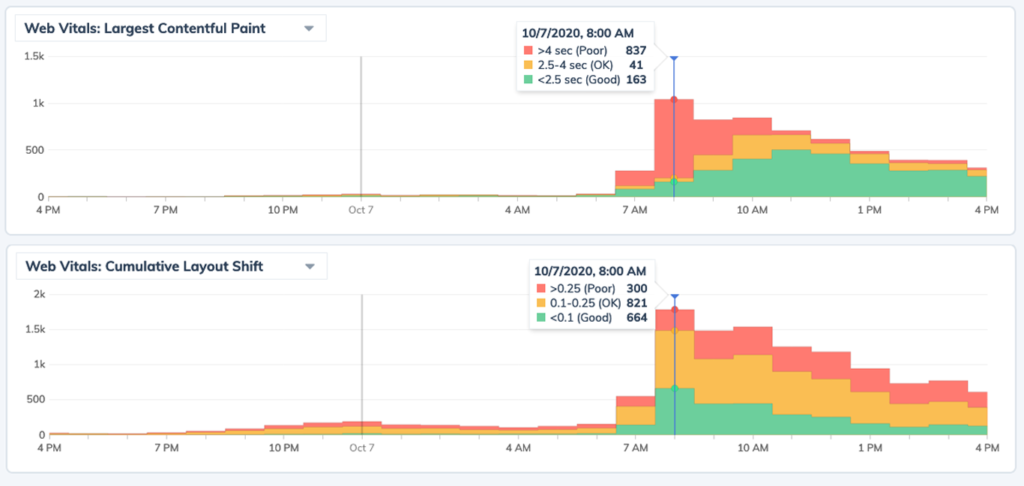
If you tried to read his post during that time, you had a frustrating experience. The page took a long time to respond, and if you got through, it was shifting around as asynchronous content was loaded and rendered. We can measure these behaviors as Largest Contentful Paint and Cumulative Layout Shift, which both degraded quickly as the traffic grew.

Clearly, it was slow. But why? Why couldn’t it serve more than 100 page views per minute? Why didn’t Cloudflare absorb the traffic? Let’s dig deeper into the page and see what’s happening.
Page Performance History
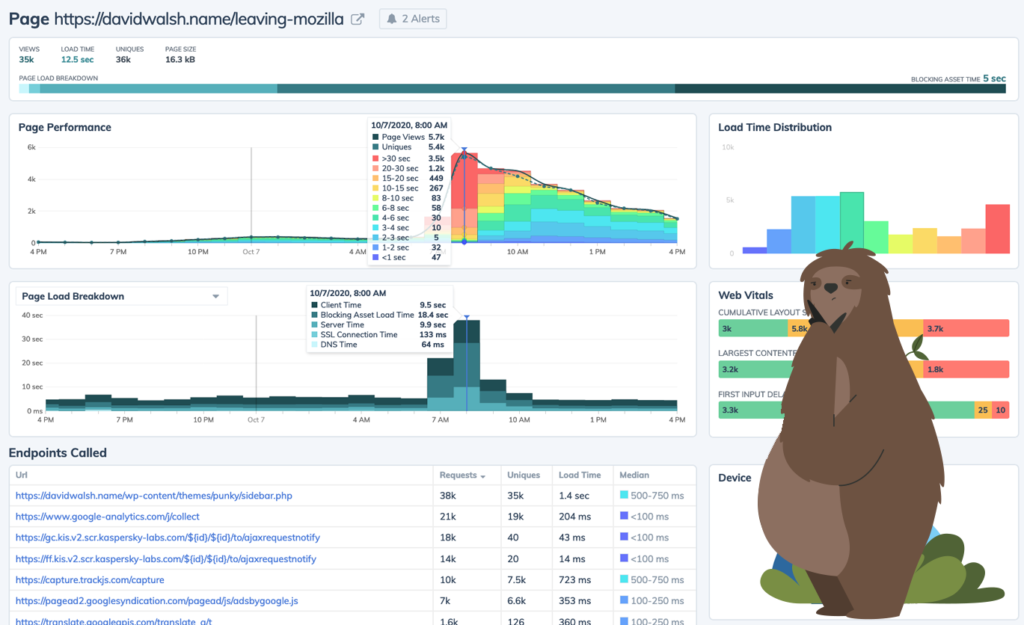
The performance report below for David’s Mozilla post shows a 48-hour window around the time he made the front page of HackerNews. The page is more than just the HTML document request; it includes all the static assets, JavaScript execution, and dynamic requests that make up the page.

Before the surge of traffic, the page had a median load time of 4-6 seconds. That’s okay but I would have expected a lot faster for a mostly-static site served from Cloudflare.
Opening the site in and checking the document request in network devtools gives us a clue.

The server is returning a cache-control header that says this content is not cacheable! Cloudflare is honoring that instruction and passing every request through to the server, as denoted by cf-cache-status: DYNAMIC.
The net effect of this is that Cloudflare has made the site slower by introducing an additional hop through their infrastructure, but not caching anything.
API Endpoint Performance
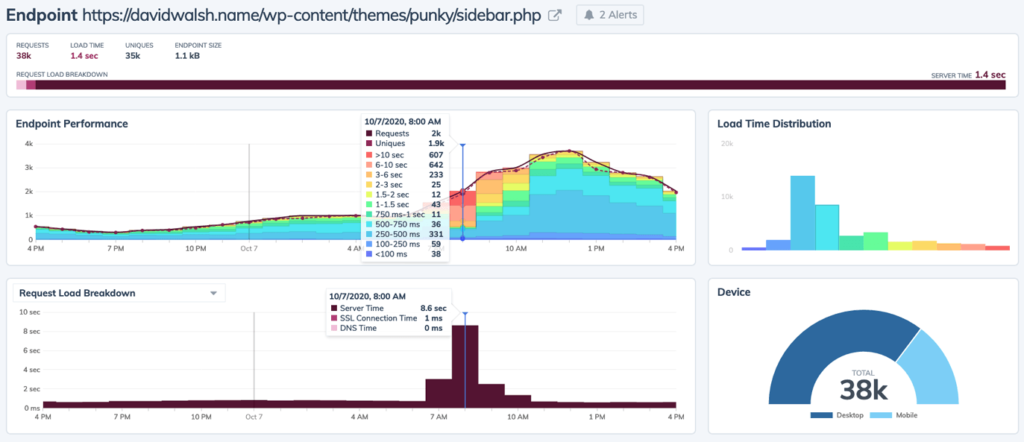
The page performance report above also shows that an API endpoint, /sidebar.php is called on every page load. The performance of this API degraded similarly with the traffic spike, but took 500ms to respond in the best of times.

Checking this endpoint in devtools, it returns an HTML snippet of what we would expect, the static sidebar content of David’s blog. And it has the exact same cache-control header problem as the main document.
By rendering the sidebar with an asynchronous uncacheable request, the server was forced to serve at least 2 database-touching requests for every person reading the post. This greatly limited the number of requests the blog was able to handle.
Web Performance Lessons
Your website is different from this one, but there are some common ideas that we can take away from this performance audit.
1. Reduce Dynamic Content
This site was producing the sidebar content dynamically. It probably doesn’t need to be. It’s the same advertisements, popular tags, and related content to a post for everyone.
Dynamic content is slow. It’s hard to cache and it often has to be fetched asynchronously. Servers simply have to do more work to produce dynamic content, and more work is always slower.
Look for dynamic content and make sure it’s really worth the performance penalty over what could be delivered statically from a cache.
2. Test Your Configuration
This site was set up to be cached by Cloudflare at one point, but over time things changed. Somewhere along the line from a WordPress plugin or hosting upgrade, the cache-control headers were changed, and the caching was broken.
Software systems are complex and ever-changing. Be sure to test things out once in a while and confirm that everything is working as it should.
3. There Is No Silver Bullet
Simply adding Cloudflare to the site did not solve the performance issues, nor should it be expected to. Caching and edge networks are amazing, but your site needs to be configured to use them correctly.
Performance isn’t something you buy or bolt on later. It’s a principle you hold while building and operating a system. Performance monitoring tools like Request Metrics can help you focus and improve your performance over time.

About Todd Gardner
Todd Gardner is a software entrepreneur and developer who has built multiple profitable products. He pushes for simple tools, maintainable software, and balancing complexity with risk. He is the cofounder of TrackJS and Request Metrics, where he helps thousands of developers build faster and more reliable websites. He also produces the PubConf software comedy show.


It would be quite nice if cloudflare warned website owners that most of their content is not cacheable. It would solve a lot of problems.
Almost had the same experience, and then discovered that Cloudflare doesn’t work as it’s advertised (or at least, what we assume generally). It doesn’t cache HTML *by default*, and fetches HTML from the origin server on every request. This is a big fail for WordPress sites, as the pages are generated on every request unless you have a page cache plugin installed.
They recently introduced a new solution for WordPress, called APO, but that’s of no use due to the same HTML cache problem. I had to add a page rule on Clouflare to cache *everything* including HTML, but that’s broken as well.
Have you considered using static site generator such as hugo, sveltekit or that react thing?