Dive Into Dojo Series: Dijit and Charting
I just wanted to give you all a heads up that I've started a Dive Into Dojo series over on the SitePen blog. The series will aim to cover the basics of jumping into the world of the Dojo Toolkit. The first two posts in the series focus on the amazing charting and Dijit UI classes.
Dive Into Dijit
From the post:
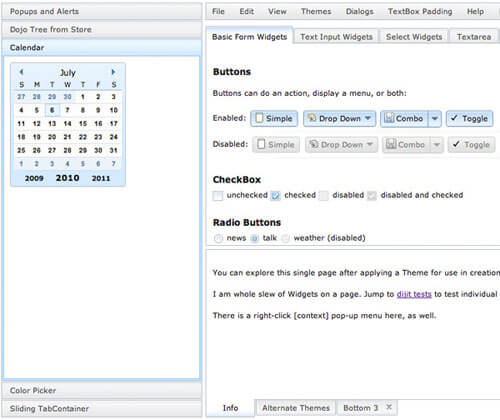
One huge feature that sets the Dojo Toolkit apart from other JavaScript libraries is its UI component system: Dijit. A flexible, comprehensive collection of Dojo classes (complemented by corresponding assets like images, CSS files, etc.), Dijit allows you to create flexible, extensible, stylish widgets.
Dive Into Dojo Charting
From the post:
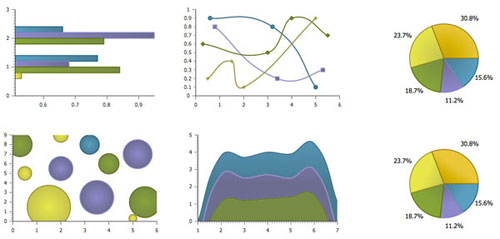
One of the most powerful pieces of Dojo is also one of the most underutilized: Charting. The Dojo Charting library lives within the DojoX (extensions) branch of Dojo, and features numerous chart types, options, and a variety of themes. This post introduce you to the charting library and show you how you can take a boring data collection and make it a beautiful visual chart in any modern web browser.
Whether you're a JavaScript noob, MooTools or jQuery enthusiast, or just someone that likes improving their web knowledge, you'll gain a great amount of insight into the advanced capabilities of JavaScript. You may be tempted to try Dojo or simply try to port the functionality to your favorite lib.
If you wouldn't mind, let me know what you think about the posts -- I spent a good amount of time researching each topic and learned a ton about JavaScript, SVG, VML, and CSS!