Use XHR/fetch Breakpoints!
Web debugging tools are so incredibly excellent these days. I remember the days where they didn't exist and debugging was a total nightmare, even for the simplest of problems. A while back I introduced many of you to Logpoints, a way to output console.log messages without needing to change the source files. Another great breakpoint type is XHR/fetch breakpoints, allowing you to pause execution when an AJAX call is made. Let's look at XHR/fetch breakpoints!
To set an XHR/fetch breakpoint, open your browser's Developer Tools and click the Sources tab -- the same tab you open for other breakpoints. Under the XHR/fetch accordion item, click the big "+" button. You'll see an empty text input:
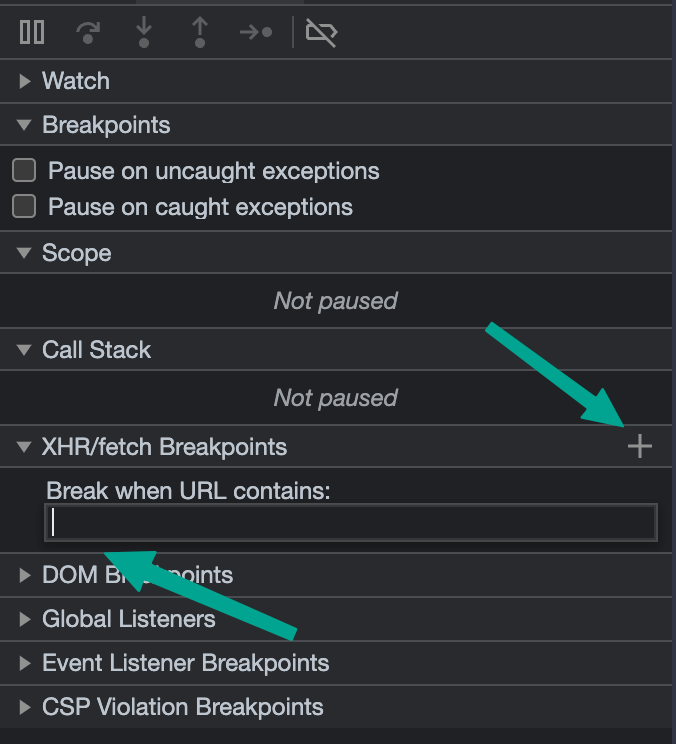
Within that text input, type a string that you'd like to break all XHR/fetch calls on. For example, if I wanted to break any time a fetch request was made, I would input davidwalsh.name:
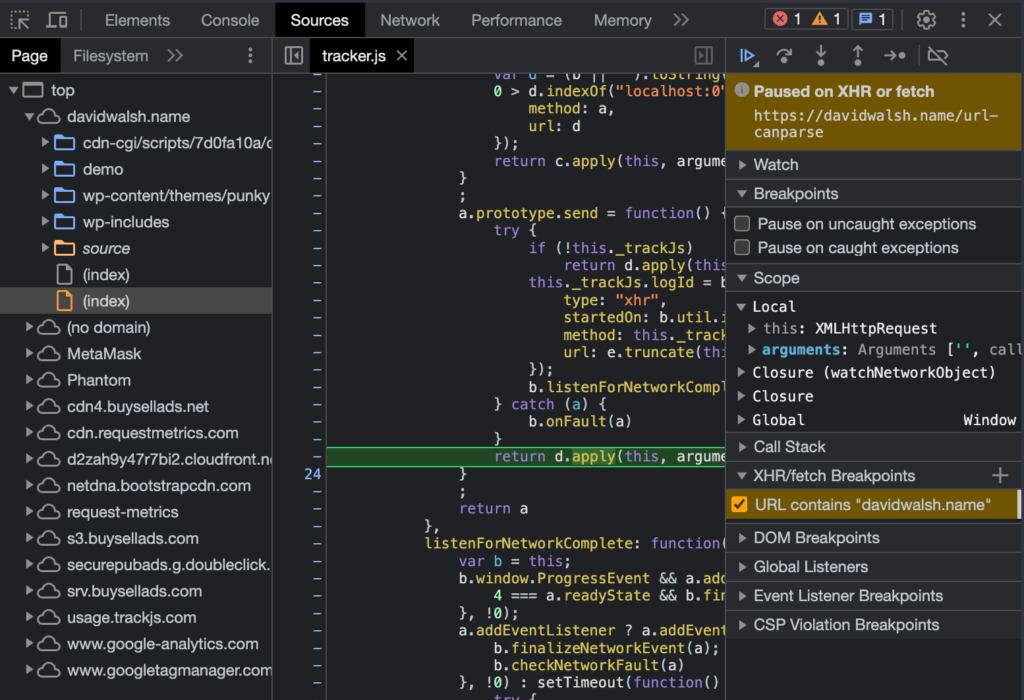
In the case above, a XHR/fetch request breakpoint halts execution because a request is made to https://davidwalsh.name/url-canparse. You'll be able to step through and step into like you can with regular breakpoints, and you'll get a full Call Stack pane to see how execution got to a given point.
XHR/fetch breakpoints are another great way to debug your web app. The more reliant we are on dynamic websites with frequently changing content, debugging fetch calls is a must. Happy debugging!


// Function to make an XHR request to a fake API
function makeXHRRequest() {
  const xhr = new XMLHttpRequest();
  xhr.open('GET', 'https://jsonplaceholder.typicode.com/posts/1', true);

  // Set a breakpoint here to inspect xhr object
  // debugger;

  xhr.onload = function () {
    if (xhr.status === 200) {
      const response = JSON.parse(xhr.responseText);
      console.log('XHR Response:', response);

      // Set a breakpoint here to inspect the response
      // debugger;
    } else {
      console.error('XHR Request failed with status:', xhr.status);
    }
  };

  xhr.send();
}

// Function to make a fetch request to a fake API
async function makeFetchRequest() {
  // Set a breakpoint here to inspect fetch options
  // debugger;

  try {
    const response = await fetch('https://jsonplaceholder.typicode.com/posts/2');
    if (!response.ok) {
      throw new Error(Fetch Request failed with status: ${response.status});
    }

    const data = await response.json();
    console.log('Fetch Response:', data);

    // Set a breakpoint here to inspect the data
    // debugger;
  } catch (error) {
    console.error('Fetch Request Error:', error);
  }
}

// Call the XHR and Fetch functions
makeXHRRequest();
makeFetchRequest();