Dynamically Create Charts Using jQuery Flot and Google Analytics
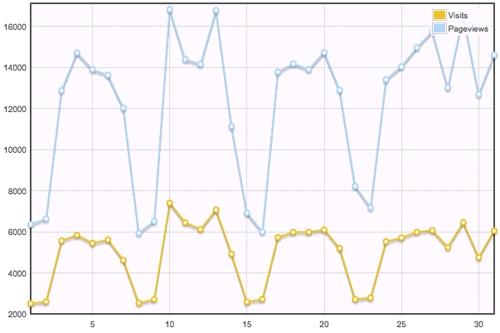
Earlier in the week I published a popular article titled Dynamically Create Charts Using MooTools MilkChart and Google Analytics. My post showed you how to use MooTools MilkChart and a splash of PHP to create beautiful charts of Google Analytics data. I was interested in seeing what jQuery had to offer in the charting department. jQuery Flot is what I found.
The PHP
/* defaults */
$month = date('n');
$year = date('Y');

/* submission? */
if($_GET['month'] || $_GET['year']):
	/* cleanse lookups */
	$month = (int) $_GET['month']; if(!$month) { $month = 1; }
	$year = (int) $_GET['year']; if(!$year) { $year = date('Y'); }
	/* retrieve information from google analytics */
	require 'ga/analytics.class.php';
	$analytics = new analytics('youraccount@gmail.com', 'password');
	$analytics->setProfileByName('yourdomain.com');
	$analytics->setMonth($month,$year);
	$visits = $analytics->getVisitors();
	$views = $analytics->getPageviews();
	/* build tables */
	if(count($visits)) {
		foreach($visits as $day=>$visit) {
			$flot_datas_visits[] = '['.$day.','.$visit.']';
			$flot_datas_views[] = '['.$day.','.$views[$day].']';
		}
		$flot_data_visits = '['.implode(',',$flot_datas_visits).']';
		$flot_data_views = '['.implode(',',$flot_datas_views).']';
	}
endif;
The above code is the same as my MooTools post with the exception of the statistics output format. jQuery flot prefers arrays instead of a HTML table.
The jQuery Flot JavaScript
$(document).ready(function() {
	var visits = <?php echo $flot_data_visits; ?>;
	var views = <?php echo $flot_data_views; ?>;
	$('#placeholder').css({
		height: '400px',
		width: '600px'
	});
	$.plot($('#placeholder'),[
			{ label: 'Visits', data: visits },
			{ label: 'Pageviews', data: views }
		],{
	        lines: { show: true },
	        points: { show: true },
	        grid: { backgroundColor: '#fffaff' }
	});
});
The above is a simple example of using jQuery Flot's plot method. Simply provide the placeholder and statistical data from the PHP above.
Comparison
- jQuery Flot provides IE support via ExCanvas, which is great.
- MilkChart allows for pie charts while Flot doesn't. I prefer pie charts to other chart types.
- MilkChart allows for easy creation of charts from HTML tables (good for accessibility) while jQuery Flot requires an array syntax.
What do you think? Which method do you prefer?


Perfect! Thanks for doing it using jQuery.
Sweet!
Great Demo, small typo in the sample “passwrod”
cheers
Wow… a great site…. and a great post… cheers !!!
Yeee! I was just wondering how to do this with jQuery, thank you :)
Doesn’t work in IE. Looks great otherwise :)
Works for me in IE7 and on my IE6 Virtual Machine, and Firefox 3. Nice, was looking for something like this.
If you like pie charts wondering why you did not use Sparklines?
FWIW, I can say firsthand that Flot is very easily customizable. I can’t judge MilkChart. MilkChart looks a bit slicker IMHO.
Pie charts are a very poor choice except in the simplest cases. So say I; but also visual data guru Tufte, strongly against them.
Nice!
did you try jqplot inspired by Flot?!
David, It could be interesting to develop this chart using AJAX (with Mootools, of course).
I cant get this to work. Do you have like an example file i could take a look at?
Static charts like this ones, for example:
http://chart.apis.google.com/chart?chs=450×200&chf=bg,s,FFFFFF00&cht=lc&chco=0077CC&chd=t:403,383,536,555,657,553,347,696,460,920,554,475,495,237,80,159,371,352,452,447,440,181,388,769,574,473,587,291,234,158,381&chds=60,940&chxt=x,y&chxl=0:|Mon+10%2F19|Mon+10%2F26|Mon+11%2F02|Mon+11%2F09|Mon+11%2F16&chxr=1,80,920&chxp=0,6.67,30,53.33,76.67,100&chm=V,707070,0,2:31:7,1|o,0077CC,0,-1.0,6
kills all the negatives of your comparison :))
Hi, can you post here your analytics.class.php becouse, I download the latest version from their website but when I try to run my code I receive error (of handling response from google).
@Vladica, the class is using Exceptions to handle errors, so put the initialization in try, catch block and print out the error.
try
{
$analytics = new analytics('youraccount@gmail.com', 'password');
}
catch(Exception $e)
{
  print_r($e->getMessage());
}
You will see the error you are getting… also it’s good idea to look through the code of the class, wherever a possible exception is thrown you need to catch it in case it occurs.
I made a Google App Engine Project with Java taking a similar approach, but anybody can use it with their own data.
Take a look
http://spanishgringo.blogspot.com/2010/03/google-analytics-evolution-time-series.html
http://gaevoluation.appspot.com
Hi david thanks for the tutorial and i’m a bit frustrated about the results on my end… though i already posted all those codes inside my page, but i still get stuck in the end resulting my page to none.
do you have any samples aside for the given demo you had here… thanks and appreciate your effort to this.
Hi David,
Just wanted to mention that flot now has a pie chart plugin:
http://code.google.com/p/flot/source/browse/trunk/jquery.flot.pie.js
Thanks for the awesome post!
no link to the php class ? how are we suppose to find the correct class file ? there are tons of GA php classes..
@VaN, the class can be found here: http://www.swis.nl/ga/
It’s linked to in the original MooTools post.
This is a great article. but i’m having trouble getting it work. Is there a demo file with all the PHP and scripts running that I could possible try working from?
Also with this script and php, can it be modified to run multiple graphs from multiple profiles? (from the same google account tho), if so that would be awesome!
Many Thanks
Hi – nice, thanx
getting some errors though:
A PHP Error was encountered
Severity: Notice
Message: Undefined index: month
Filename: views/admin_welcome_view.php
Line Number: 6
A PHP Error was encountered
Severity: Notice
Message: Undefined index: year
Filename: views/admin_welcome_view.php
Line Number: 6
PHP is not a happy place for me – anyone shed any light? or have any guidance pls.
Cheers
Undefined indexes are PHP Notices or Warnings. Check that the array key exists with a
array_key_exists(‘month’, $array);
Before trying to pull the array index. I haven’t seen your code so I can’t really give to much advice on it, but I normally use a method to check if the array key exists and is not empty before accessing it, something like
function key_exists ( $key, $array )
{
return (bool) ( array_key_exists ( $key, $array ) && !empty ( trim ( $array[$key] ) );
}
That should work without throwing any notices.
@Shawn Crigger : Way using all that when you can simply use an
isset?$year = isset($_GET['year']) ? $_GET['year'] : date('y');Hi David,
I will be really very thank full you if you can gave me all the code How can i get analytical chart data from analytical account and show up on chart.
I had found lot of links and way in google but really no one is help full.
Actually i want to display all info of my google analytical account in my custom website admin panel.
Thanks in advance,
Thanks,
Ramesh