Use Mozilla Firefox DevTools in Chrome
I shared on Twitter last week that I do casual browsing in Google Chrome but do most of my development work in Firefox. I can't give a great reason for doing so but Firefox has seemed like a development "security blanket" since I was in college (over a decade ago!). The only time I use Chrome's development tools is when I have a Chrome-specific bug. Only recently I found out about Mozilla's Valence project; Valence allows developers to use Firefox Developer Tools in projects other than Firefox.
Valence is available as a standalone utility but also gets installed when you open Firefox's WebIDE, commonly used to debug Firefox OS apps. Assuming you have both Firefox and Chrome on your machine, you can kick off the process with the following shell command:
$ /Applications/Google\ Chrome.app/Contents/MacOS/Google\ Chrome --remote-debugging-port=9222 --no-first-run --no-default-browser-check --user-data-dir=$(mktemp -d -t 'chrome-remote_data_dir')
That command opens Chrome with port 9222 open for debugging connection. With the connection open, you can open Firefox's WebIDE, select "Chrome Desktop", and you now have access to debug Chrome with Firefox's DevTools as such:
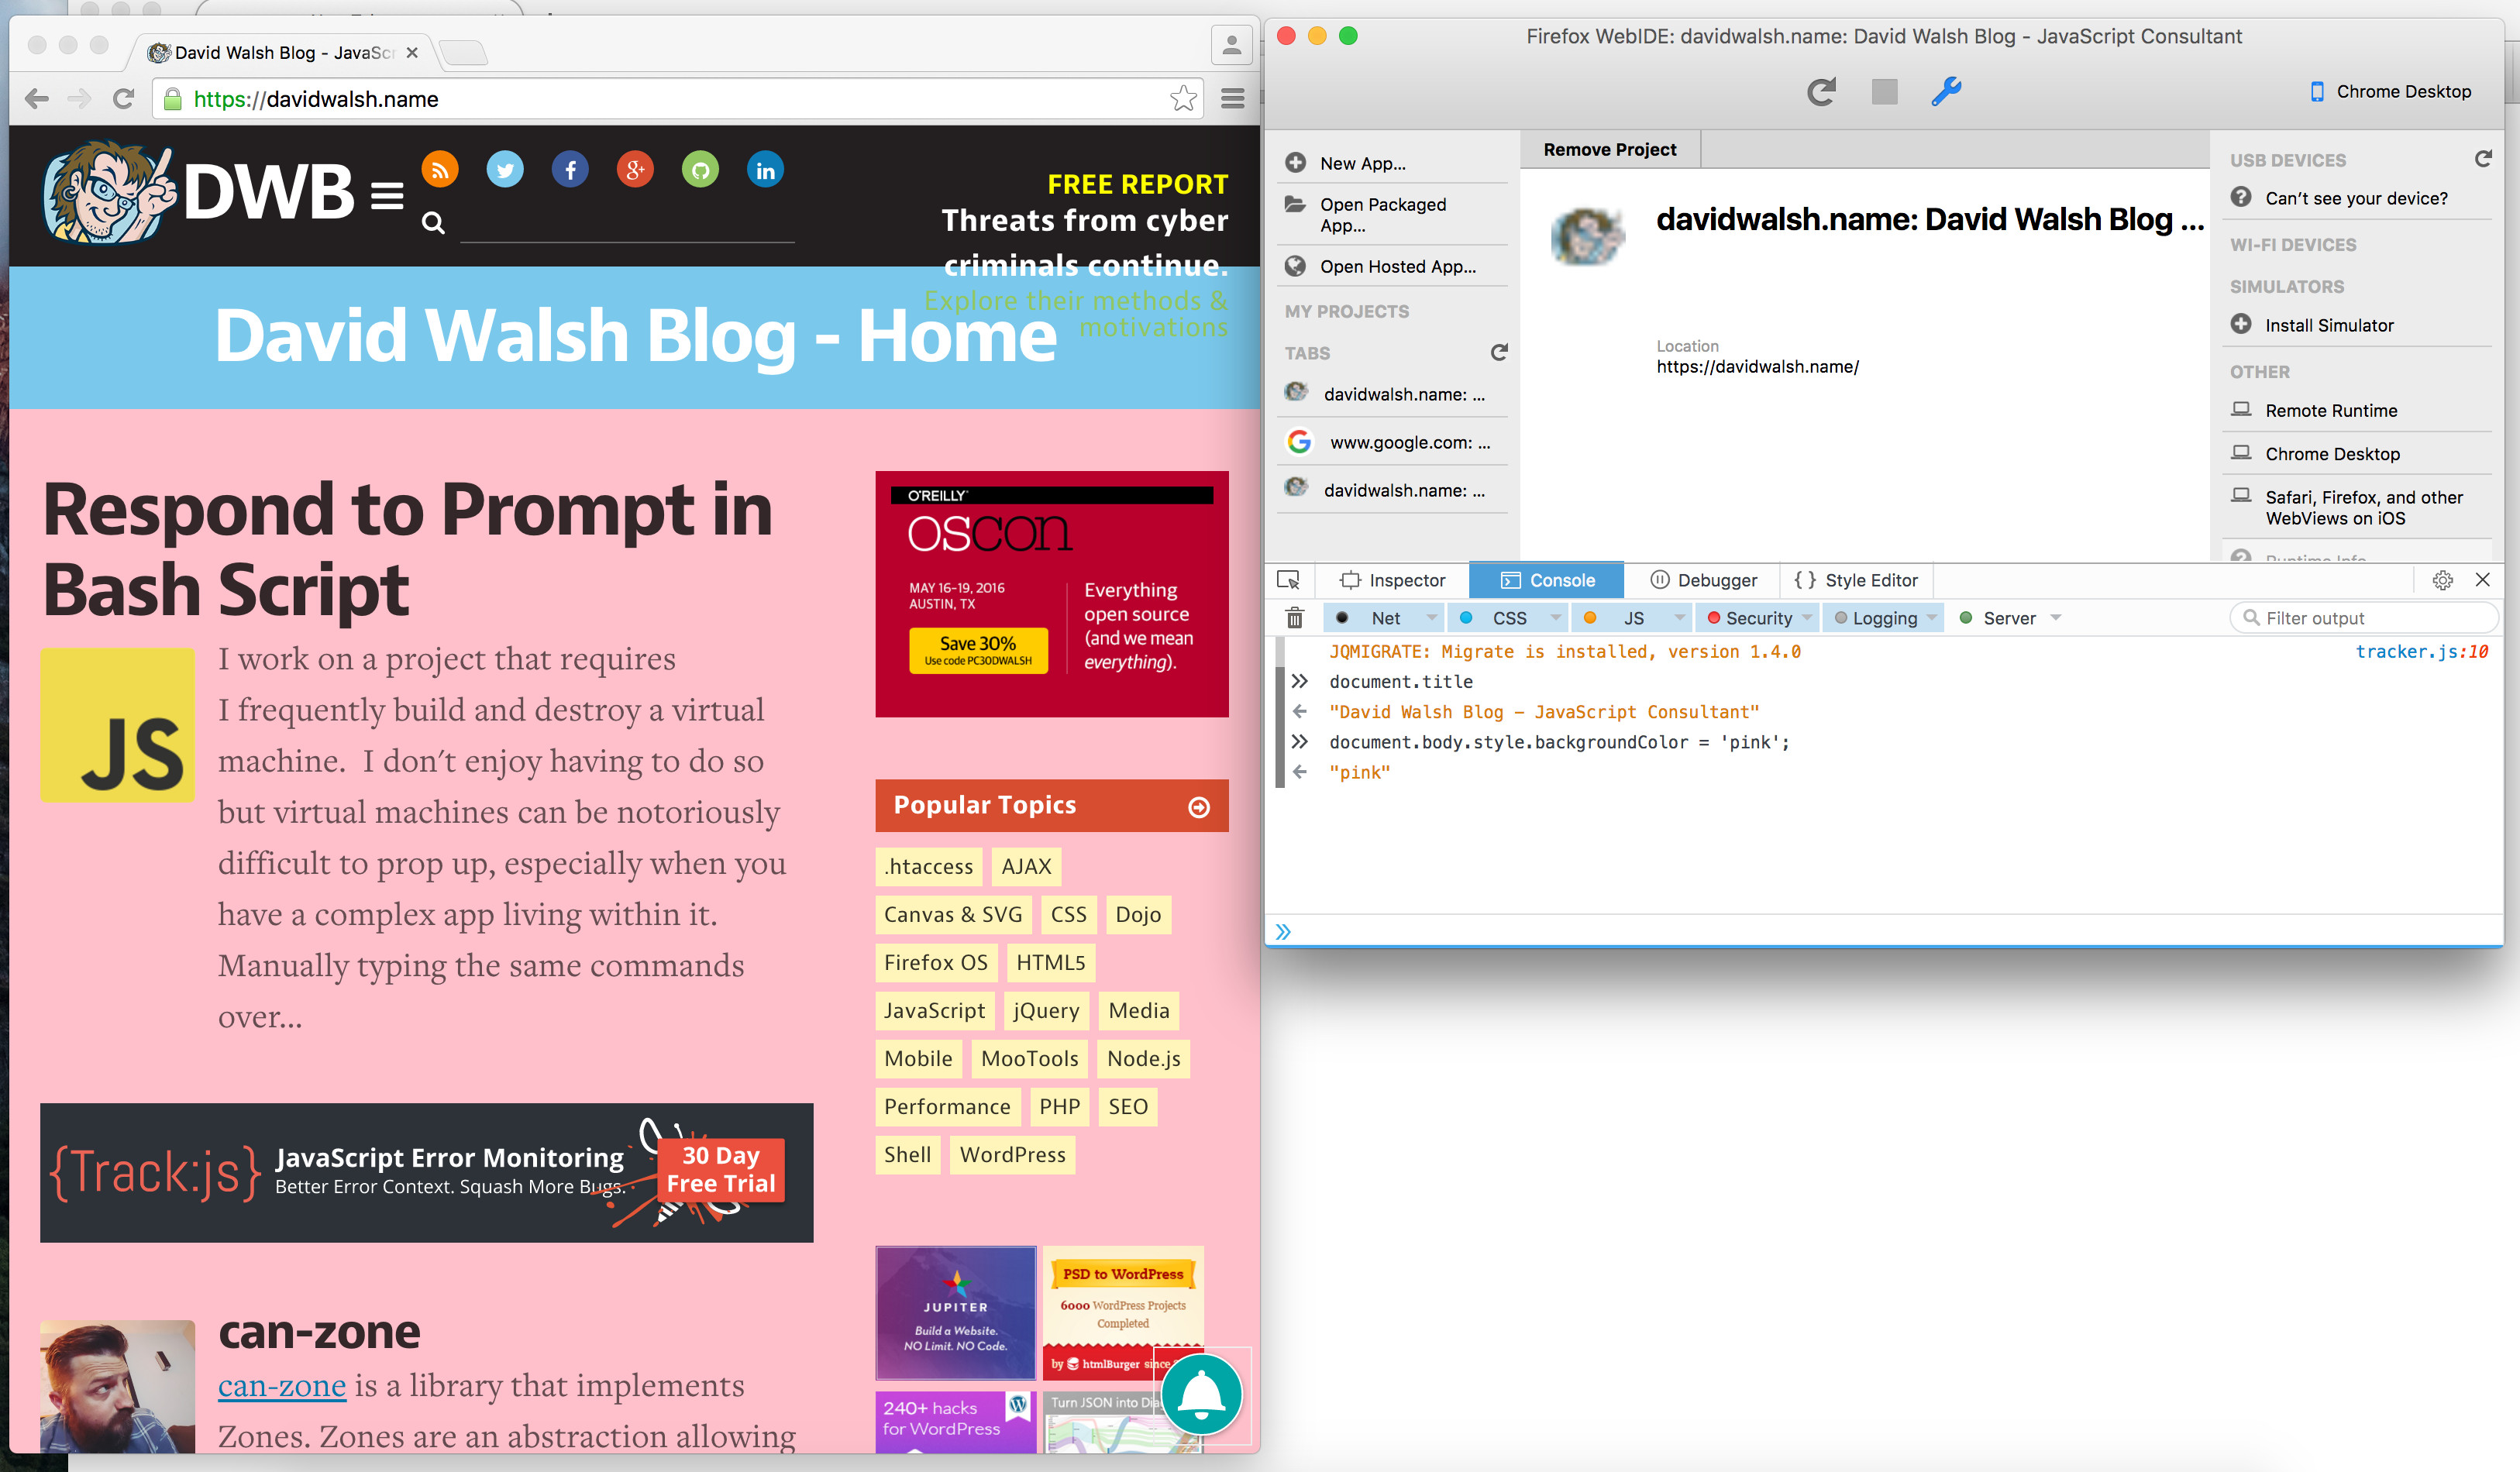
Awesome on both Mozilla and Google's part to allow this type of functionality. The browser wars are (mostly) over and we're now focused on making web development easier on ... brace yourselves ... web developers. I'm thankful that this type of functionality exists -- now I get the best of both worlds!


You can also use this to debug Safari on iOS from Windows, alas the WkWebViews used in iOS Firefox and Chrome aren’t accessible
That’s interesting. I wonder how you can do that in Windows though
I’ll have to attempt this in the future. I’m the only one who uses Firefox for debugging here while everyone uses Chrome. I’m more of a Firebug girl though. Lately, Firebug has been crashing so I’ve had to rely on the browser tools >_<
Thats kinda of funny, I ‘grew up’ on Firefox and its dev tools… (firebug/firebug-lite even) and the current state of the dev tools in Firefox just… turns me away :( Anytime I have to use them it takes me an extra 10 minutes just to find and figure things out… The chrome tools just “make sense”…
I wonder if this means we can use Chrome dev tools in Firefox in a similar manner… Will have to look into that for my work issues.
@Karl I feel exactly the opposite: I think the FFx tools “just make sense” and the Chrome ones take me a while to figure out. The Chrome tools (and it seems like I’m the only one in the world who feels this way) are simply not as easy to use.
So, this got me interested in Firefox dev tools. Although I do keep an eye on its development, it has been a while since I really got in there and worked with it. The first few things I tried were the developer productivity/debugging/convenience shortcuts available in Chrome’s dev tool console.
Things like
1. $1..4 not available
2. debug(functionRef), monitorEvents(window, ‘scroll’) etc. not available
3. getEventListeners(myDomElement) not available
4. Shortcuts to fuzzy search files, functions etc. not available
These are just a few I checked and saw not working on firefox dev tools. Immediately made me go back to Chrome dev tool. Any specific feature that Firefox dev tool is rocking that Chrome dev tool is not? Chrome dev tool seems to be light years ahead in the game.