How to Build Charts in Angular
It is very easy to get lost in the flood of JavaScript frameworks and libraries that we, as front-end developers, have to choose from these days. Every week some new framework springs up and takes you back to the comparison board, making your task of selecting the right one extraordinarily difficult. You don't even know that the new shiny thing that looks great today will survive even the next six months.
But if there is one framework that has done consistently well over time, it has to be Angular. It is backed by some of the biggest companies and it sure is here to stay.
So today I'm going to give you a tutorial on how to visualize data using Angular - something that every developer should know. We are going to learn how to make beautiful charts using Angular, FusionCharts and its Angular charts plugin.
Part 1: Building Your First Chart in Angular
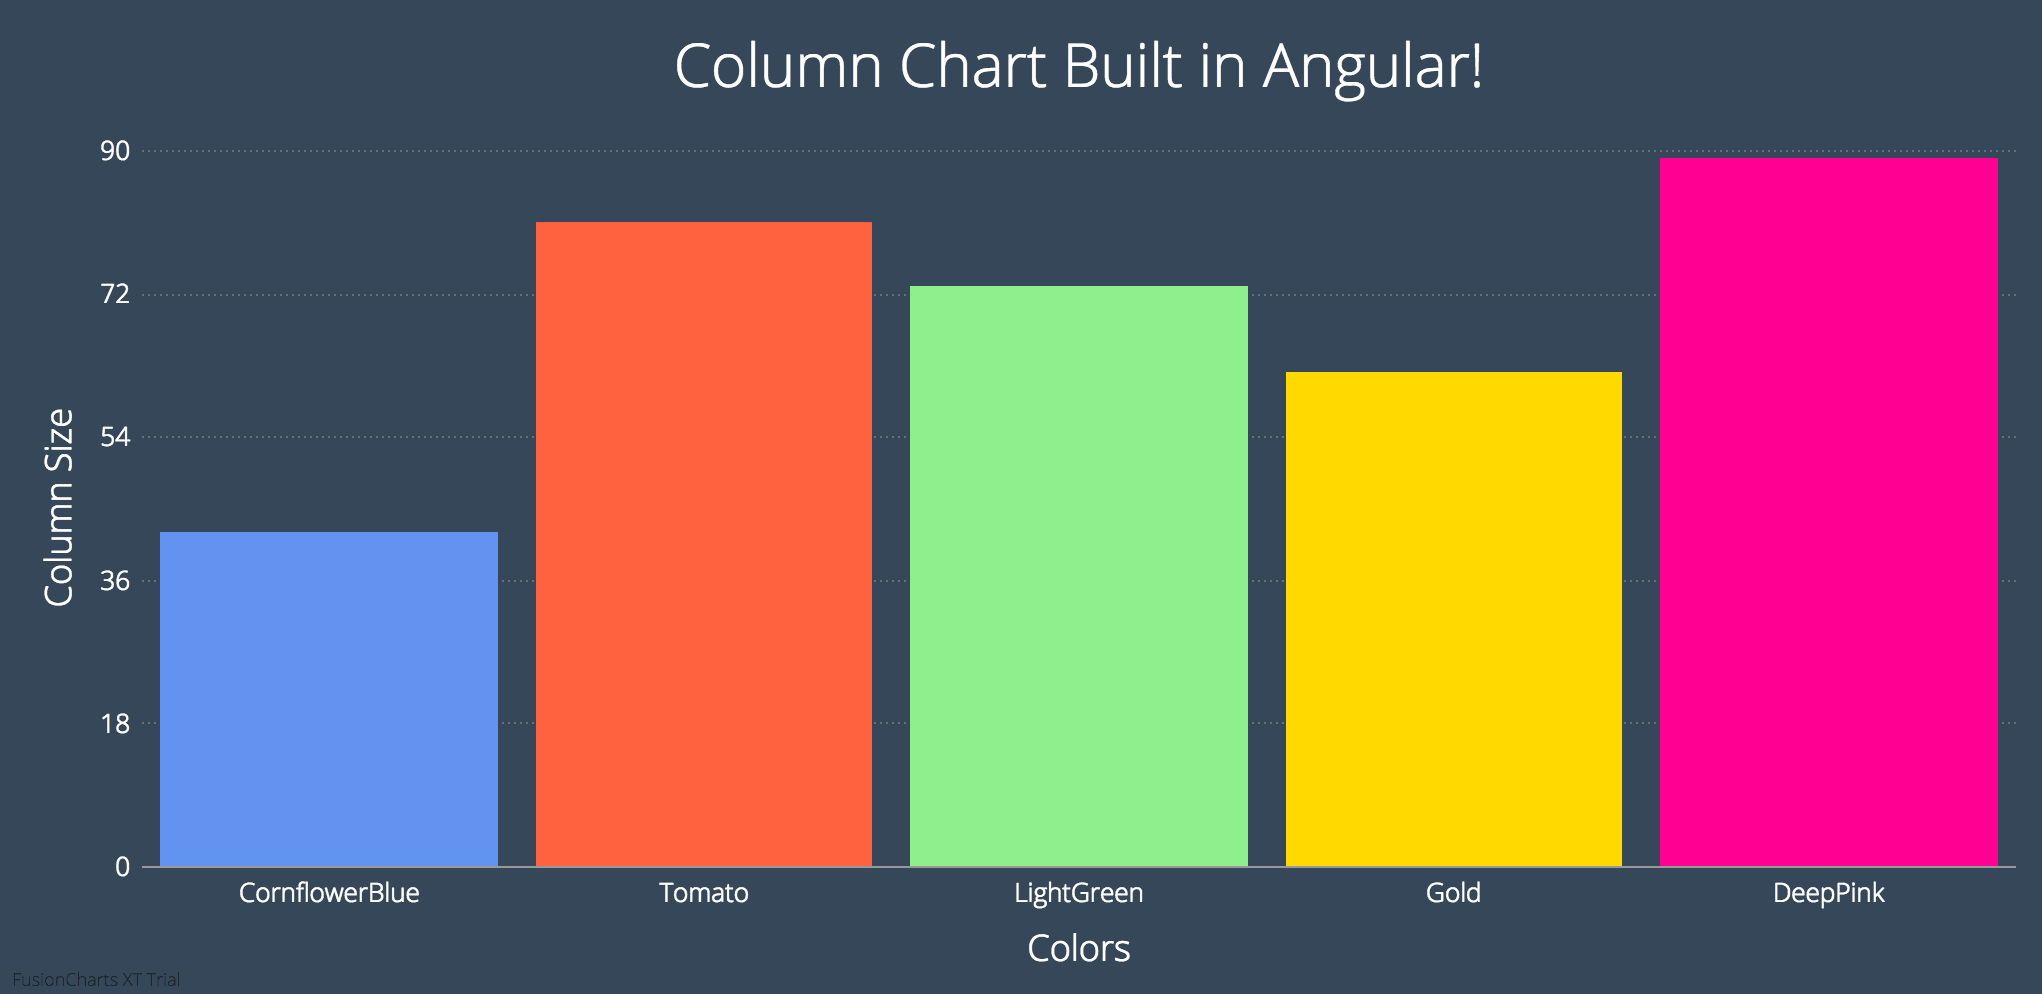
I have divided the complete process into four easy to understand steps. This is what we are making (you can see live version here, and find GitHub repo here):
Step-1: Include required JavaScript files
Our project is dependent on following three files:
- Core AngularJS library: any minified 1.x will work.
- FusionCharts’ JS charts files: get them from here.
- Angular charts plugin: get it from here.
From FusionCharts core package, we need to include both fusioncharts.js and fusioncharts.charts.js present inside JS folder.
We will include all the above files using HTML <script> tags:
<!-- AngularJS library -->
<script type="text/javascript" src="angular.min.js"></script>

<!-- FusionCharts library-->
<script type="text/javascript" src="fusioncharts.js"></script>
<script type="text/javascript" src="fusioncharts.charts.js"></script>

<!-- Angular plugin -->
<script type="text/javascript" src="angular-fusioncharts.min.js"></script>
Step-2: Create the AngularJS App
Next we need to create the Angular app and inject ng-fusioncharts module, which is the plugin we are using. This is how we do it:
var app = angular.module('chartApp', ['ng-fusioncharts']);
Step-3: Define controller
In this step we will define a controller for our app. For this, we augment the controller scope with datasource and other chart configurations for our chart:
app.controller('MyController', function($scope) {
  // chart data source
  $scope.dataSource = {
    "chart": {
      "caption": "Column Chart Built in Angular!",
      "captionFontSize": "30",
      // more chart properties - explained later
    },
    "data": [{
        "label": "CornflowerBlue",
        "value": "42"
      }, //more chart data
    ]
  };
});
$scope.dataSource in the above code snippet will have all the content related to our chart - chart configuration and chart data in our case. For other chart types it may contain other things as well.
A lot of configuration can be done through chart object but I am not covering it here as it is not required to plot a basic chart. You can jump to last section - ‘Improving the Design’ - to learn more about it.
Step-4: Render the chart
We are almost done now. To render the chart, add fusioncharts directive inside the <div> where you want to render your chart. This is how we do it:
<div ng-controller="MyController">
    <fusioncharts
        width= "100%"
        height= "400"
        type= "column2d"
        dataFormat= "json"
        dataSource= "{{dataSource}}">
    </fusioncharts>
</div>
In the above code we used:
widthandheightto set chart size. A width of 100% makes the chart take up full container width and makes it responsive.typeto set the chart type. You can find alias for the chart you want to plot on this chart list page.dataFormatto define the data format we will be using to feed data.dataSourceto define content for our chart (see step-3 for more details).
Part 2: Event Handlers
Plotting charts that look good is one thing, but to make them truly interactive you need some way to handle events. Good for us, FusionCharts has made it easier to add a variety of events to its charts. Event handling is a big topic in itself and my goal here is to give you a basic overview. It will help you build a solid foundation so that further exploration becomes a little easier.
In this example I will make use of dataPlotClick event. Data plot refers to the column in a column chart or line in a line chart. dataPlotClick is triggered when someone clicks the data plot. In our case whenever somebody clicks a column, we are going to display the color of the clicked column below the chart.
<div class="statusbar" style="{{ colorValue }}">{{ selectedValue }}</div>
$scope.selectedValue = "Please click on a column";
$scope.events = {
  dataplotclick: function(ev, props) {
    $scope.$apply(function() {
      $scope.colorValue = "background-color:" + props.categoryLabel + ";";
      $scope.selectedValue = "You clicked on: " + props.categoryLabel;
    });
  }
};
Event handler receives ev and props as its arguments:
evcontains details related to the event - type of event, event id etc.propscontains details about the particular data plot on which the event occurred. In our case it will have label, value etc. of the column that was clicked.
We extract and pass the label of the clicked column using props.categoryLabel. We then change text and background color using that value.
To explore more on events, please visit this API reference page. It has good description and a working JSFiddle demo for every event.
Part 3: Improving the Design
Although I wanted to study design, I never devoted time to it. And now when I have to design a page or any app that I am working on, I just use my gut feeling, but I digress. So coming to our Angular charts, there is a lot you can do to improve the look and feel of your charts using something known as chart attributes.
There are hundreds of things you can customize for a chart. For example, you can use baseFont to change the font family of your chart. You can use bgColor to change the background color of your chart.
I can go on and on about this, but it won’t make a difference. Best it to bookmark the page linked above and just search for the chart type you are making. Whatever you think of customizing inside a chart, you will probably find an attribute for it.
Have any questions? That’s what the comments section is for ;) Feel free to ask. I will be more than happy to help!


About Vikas Lalwani
Vikas is a budding programmer who likes to have fun with front-end technologies. You can see some of his tiny experiments on his website. He works at FusionCharts and always available for a quick chat.


Is Fusion Charts free to use?
Yep! It’s absolutely free for personal and non-commercial use. No feature restrictions, no watermark etc. etc.
Only if you want to deploy it in a commercial application, you need to spend some $$ :)
Does this help?
I’ve created an angular directive for xCharts which is a nice js chart library tenxer.github.io/xcharts/. You can install it using bower, quite easy: github.com/radu-cigmaian/ng-xCharts
Highcharts is also a solution, but it is not free for comercial use.
I have used Highcharts and I think they provide best data representation methods. Yes they aren’t free but so far they are sufficient to meet all your needs
Hi, I am trying to make a chart using external json file but when I run the code it displays nothing not even in the console. Please have alook at my code below and suggest where i the problem
Can anybody tell
Jasmin, I guess your issue got resolved. Right?
Hey Vikas!
I’m trying to load in data for my chart from an external JSON file. Would you be able to share any experience you have of doing this?
What is angularJS version? I am getting module load error.
How can i avoid fusionchart initial render when datasource scope model
(undefined or null) because its showing no data to display.but chart data update after 2 seconds while receving some data from ajax call and map to datasource scope model.thanks
Goal- > i want to show “loading data msg” instead of “no data display msg”
Hi David,
Great tutorial. I have a REST endpoint that currently returns the sample data below, please can you teach me how I can use this as my datasource:
[
  {
    "label": "Year One",
    "value": 6600
  },
  {
    "label": "test",
    "value": 0
  },
  {
    "label": "JS 11",
    "value": 0
  },
  {
    "label": "JSS 1",
    "value": 0
  },
  {
    "label": "JSS III",
    "value": 0
  }
]
Thanks in anticipation.
I have the same question
i have the data in the same json format coming from REST API.
Hi David,
Great tutorial. but this plugin is not working with $http service. why so?
Hi,
Do you have example on how to integrate fusioncharts with webpack?
Thanks
Hi,
Thanks, this tutoriel is very interesting!
I want to change chart type, how can i change chart type using AngularJs?
i tried to change the type but i found chart type not supported.