Toggle Element State with Google Chrome and Mozilla Firefox
It's much easier to debug CSS than JavaScript since there are many fewer interactions in CSS, and they are much easier emulate. Still, element state debugging isn't simple...until now. Google Chrome's WebInspector and Mozilla Firefox's Firebug have a really sweet feature I just discovered which allows the developer to apply element states for the sake of debugging.
Chrome's WebInspector

The image above displays Chrome's "Toggle Element State" button, allowing developers to toggle CSS states via checkboxes.
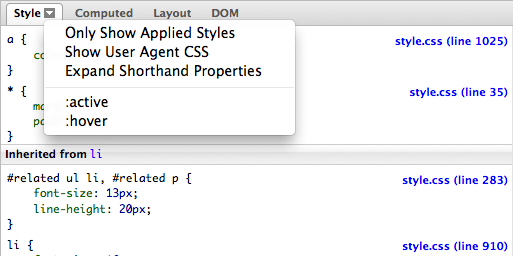
Firefox's Firebug

The image displays Firebug's likewise menu, triggered by the down arrow on the CSS tab for an element.
This allows active CSS state bugging vs. simple CSS explorations to be much, much easier. Happy CSS debugging!
![From Webcam to Animated GIF: the Secret Behind chat.meatspac.es!]()
My team mate Edna Piranha is not only an awesome hacker; she's also a fantastic philosopher! Communication and online interactions is a subject that has kept her mind busy for a long time, and it has also resulted in a bunch of interesting experimental projects...
![Write Simple, Elegant and Maintainable Media Queries with Sass]()
I spent a few months experimenting with different approaches for writing simple, elegant and maintainable media queries with Sass. Each solution had something that I really liked, but I couldn't find one that covered everything I needed to do, so I ventured into creating my...
![MooTools TextOverlap Plugin]()
Developers everywhere seem to be looking for different ways to make use of JavaScript libraries. Some creations are extremely practical, others aren't. This one may be more on the "aren't" side but used correctly, my TextOverlap plugin could add another interesting design element...
![Drag and Drop Z-Index Stacking]()


Great tip, thanks =)
FireBug does this for years. Just click the little arrow next to the style tab. It’s only
:hoverand:active, though.Awesome, just added that as well.
The only thing Chrome cant do with states is when I need to debug an element that matches selector
parentElement:hover element, for exampleChrome applies states only to selected element in inspector and when you selected another element, selected state is applied to new element
Next challenge: Debug pseudo elements with web inspector :p
the Chrome web inspector already supports pseudo elements.
Under the Matched CSS rules is a Psuedo element
I believe the latest version of firebug does similar, but I’m not sure as I haven’t used it in ages
Unfortunately you can not select the pseudo element like any other DOM-Element. Technically this is perfectly valid since pseudo-elements are not part of the DOM but I often miss that feature. Pseudo-elements are harder to debug than necessary.
Good stuff, from what I know this has been around for a while already.
@JAN BECK – not that hard really, you just have to select the main element and scroll down in the inspector panel to see the psuedo elements
it’s also possible to do this with Firefox’ built in developer tools :-)