Measuring Performance
Clients care deeply about web performance and they depend on us to articulate and measure how well their website is performing. If you have a service level agreement (SLA) with your client, and you should, then learning how to measure key metrics is crucial to you and your business. There are great paid products on the market that can keep track of a website's performance, but there are plenty of websites and JavaScript APIs that can help you measure these metrics free of charge.
Real User Monitoring (RUM)
Real user monitoring is collected using data from...well, real users! It helps in identifying how long it takes actual users to process the request, render the DOM, and more. There are very good paid products that can measure and provide online dashboards for viewing RUM data, such as New Relic's Browser Monitoring and Soasta's mPulse, but if you're on a budget it can be hard to afford those services. Luckily there are tools built into most browsers that can help us!
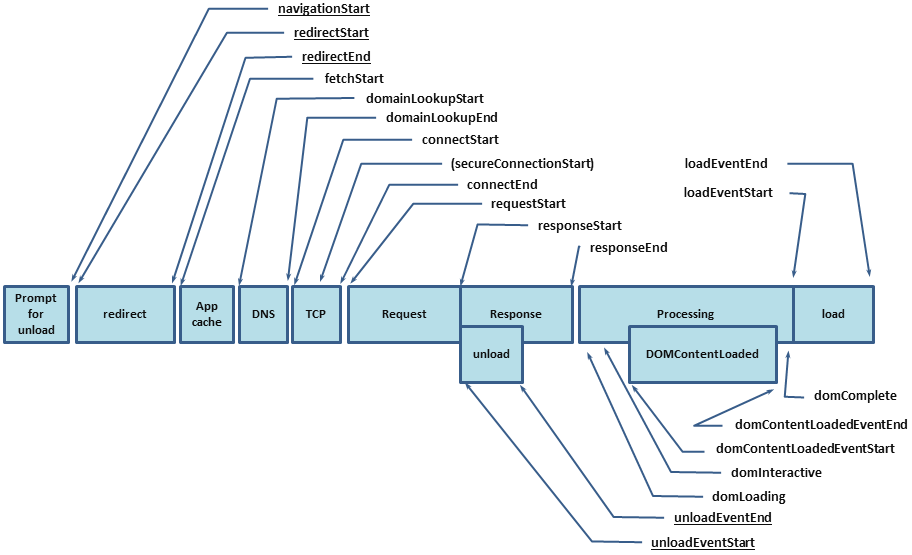
There are two Javascript APIs that, for the most part, collect the same data that many paid products collect and report. First up is the Navigation Timing API. This API allows you to see what time different events fired off when loading a page. Let's check it out right now! If you're in Chrome or Firefox while reading this, open up the console by right clicking on the page and choosing Inspect Element. Then in the console paste performance.timing and hit enter/return. You should see something like this:

Each of these values is the time at which different events were fired when loading the page. You can check out the specification to see a description for each event. To show an example, if you wanted to get the amount of time it takes to load the DOM you would use this equation: domComplete - domLoading. Note that the time is measured in milliseconds. The Navigation Timing API is well supported with most browsers. Support starts in IE 9+, Chrome, Firefox, Safari 8+, Opera and Android. iOS Safari and Opera Mini are the only ones not on board.
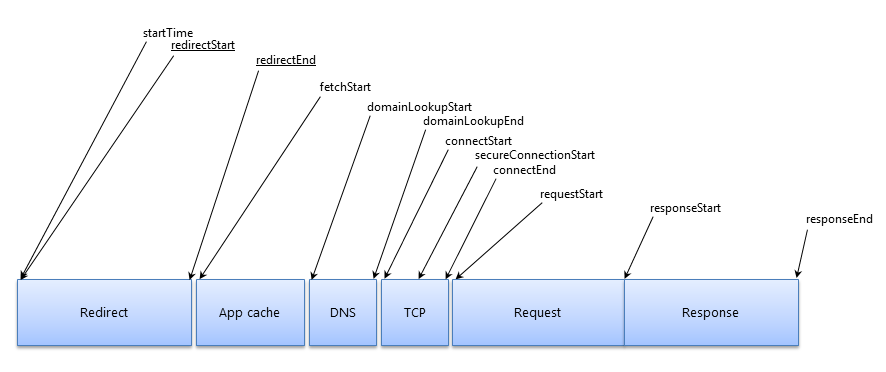
The next Javascript API is the Resource Timing API. This API allows you to see how long each resource (images, Javascript files, CSS files, etc.) took to be fetched. This can be helpful in pinpointing what files are taking the longest to load. Let's go back to the console and paste in window.performance.getEntriesByType("resource") to see an example.

You'll notice that this looks very similar to the Navigation Timing API with a few differences. This API gives you the type of resource, in this case an image, and also the name of the resource, in this case resource-timing-overview-1.png. It also helps you by calculating the duration for you, which is done by use the equation responseEnd - startTime. This API has the same browser support as the Navigation Timing API, except that Safari doesn't support it.
There are other APIs available that don't have great browser support but are immensely helpful in determining more meaningful metrics. The first being the User Timing API which can help you measure how long your AJAX requests are taking or help you in measuring other Javascript tasks. Browser support isn't the best, but Chrome, IE 10+, and Android browsers are supported for the moment. Another API is the Network Information API. One of the biggest drawbacks to collecting RUM data is not being able to determine what kind of network connection the user is using. This information is helpful because mobile networks take longer to fetch a website than cable networks. Browser support is limited because Firefox OS and Chromium are the only browsers that currently support the API.
To start gathering RUM data you can create a Javascript script that runs onLoad, calculates the measurements, and uses AJAX to send the information to a server side script that will store that data in the database. We'll take a look at an example of this later.
Synthetic Testing
Testing in the wild with RUM data is essential but it has its limitations. We need a way to control the variables such as connection speed, geographic location, and the user's browser. What's more, in order to really get meaningful data we need to be able to see how the website is loading for the user via video or images. There are great paid products that allow us to have this laboratory type setting, such as New Relic's Synthetics and Catchpoint's Synthetic Testing & Monitoring, but let's take a look at one free tool that meets these needs: WebPageTest.org.
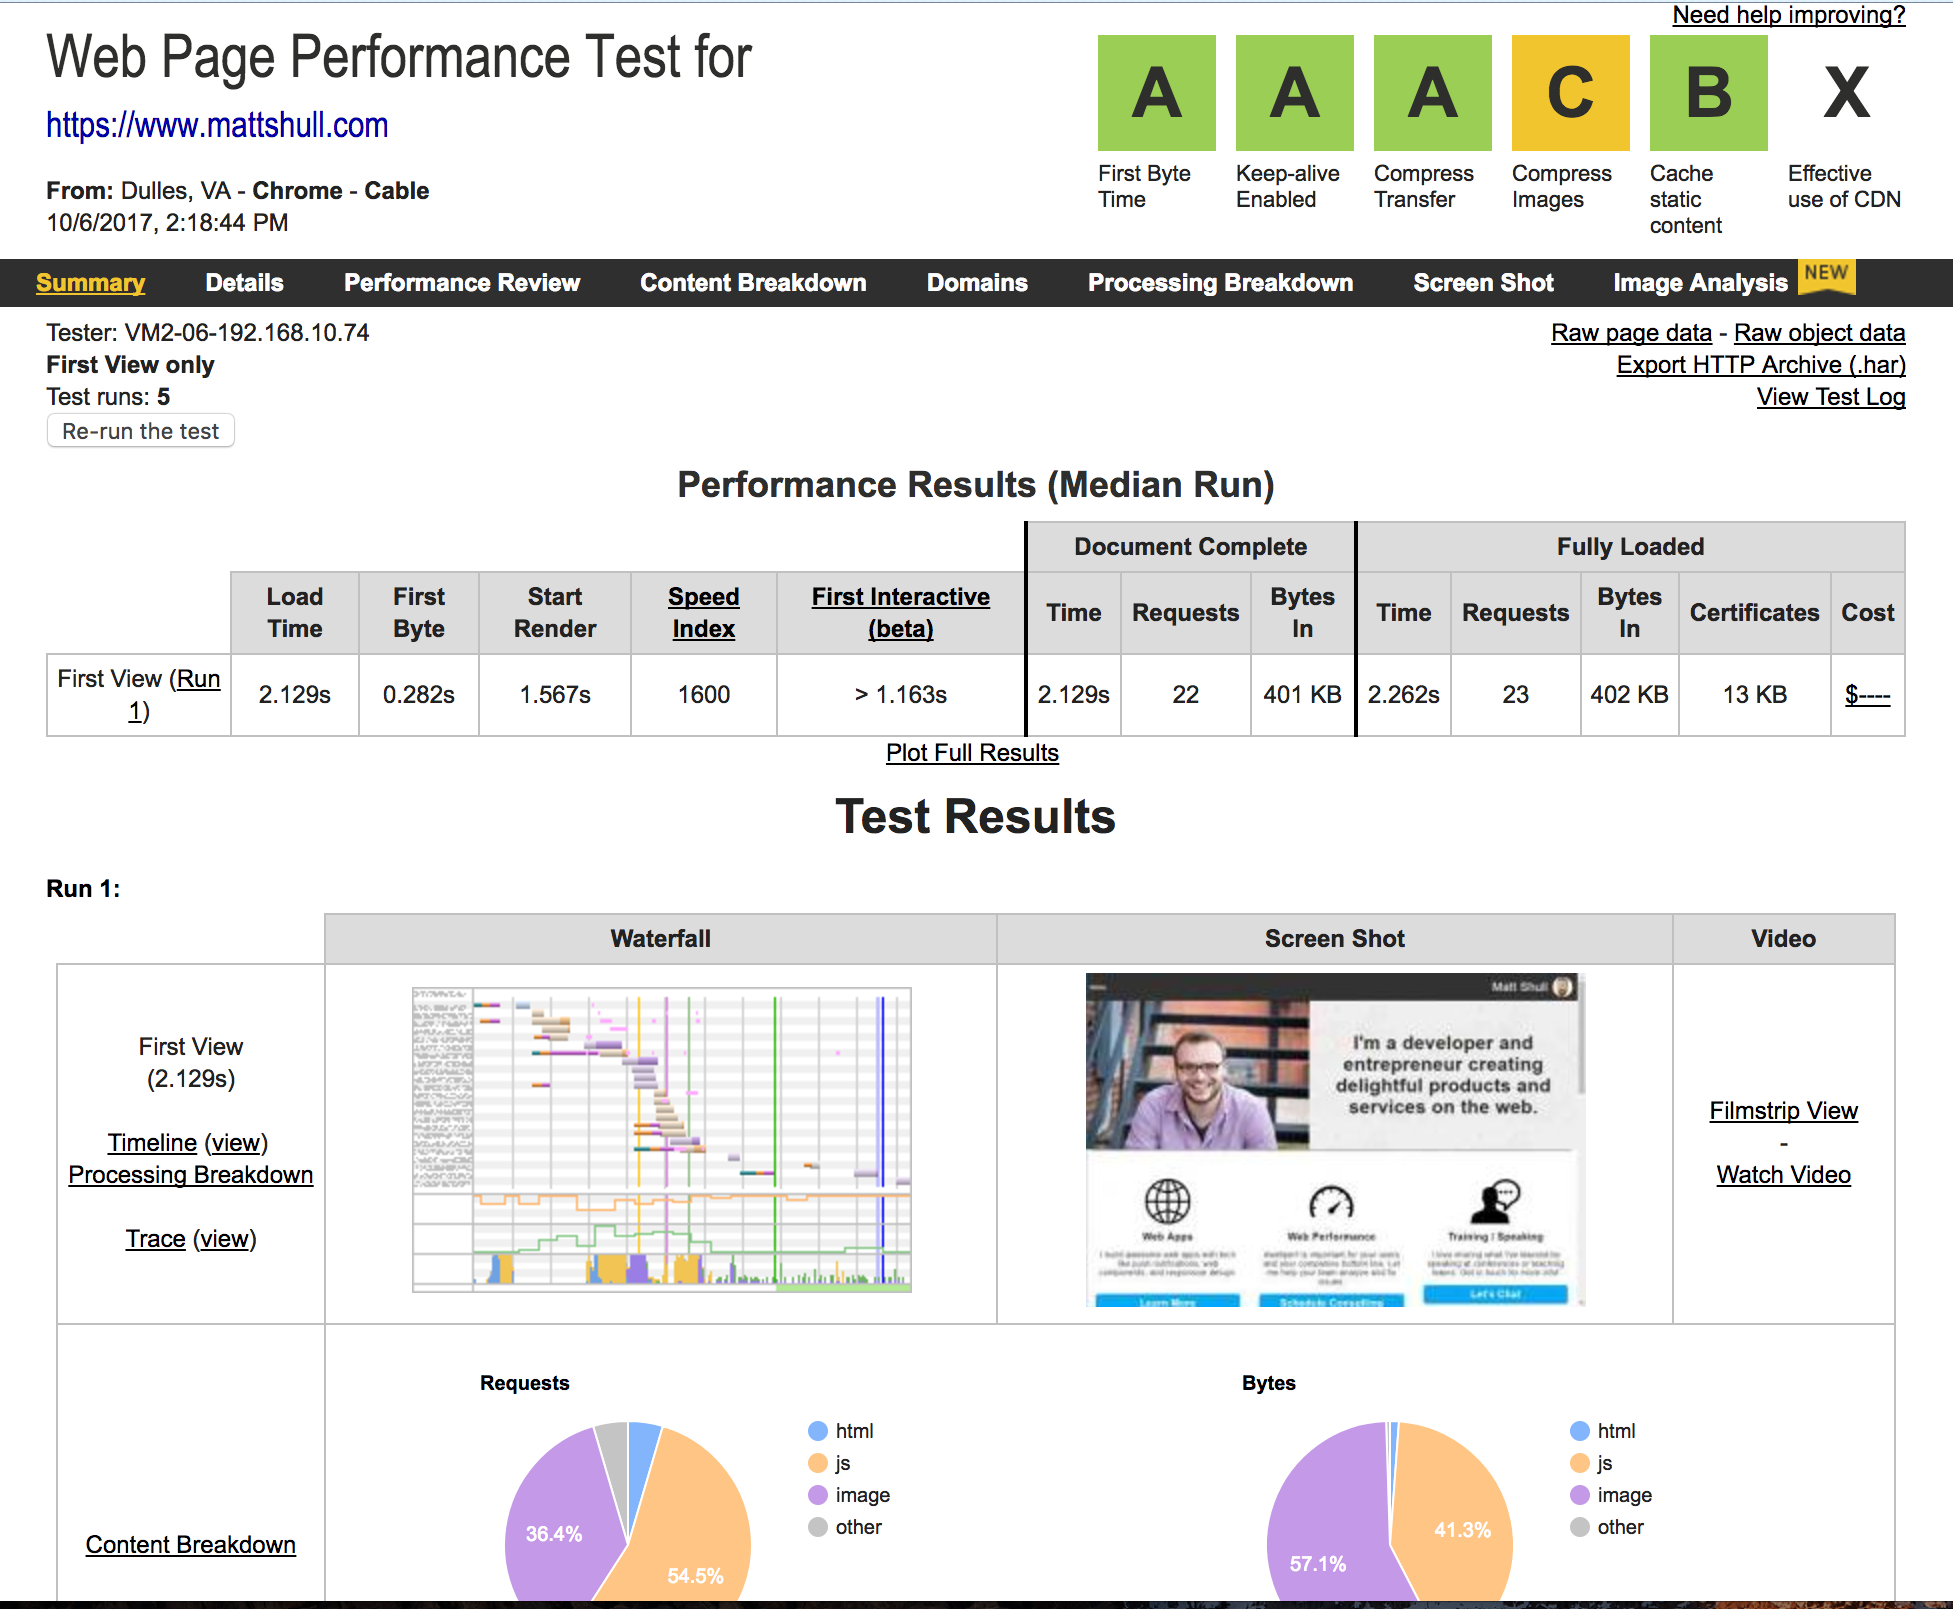
WebPageTest makes it very easy to synthetically test a website for free. Once you're on their website you enter the URL you'd like to test, select the location you want to test from, and select the browser you'd like to use for testing. In the advanced settings you can set connection speed, how many tests to run, whether to capture video of the page loading, and more. Once you run the test it will provide you with results like this:

WebPageTest gives you a letter grade for different metrics and provides you with detailed information of how the page loaded, even providing you with CPU and Bandwidth utilization. There are three metrics that can provide you with meaningful data: First Byte, Speed Index, and Bytes In. First Byte is the amount of time it took to make the website request and have the server send the first byte back to the browser. This metric also has a letter grade provided. If this metric is high, meaning it receives a C or worse as a grade, it could mean that the server is taking a long time to process information before sending it back to the browser. It could also mean that it takes a long time for the browser to connect to the domain.
The second meaningful metric is Speed Index. Speed Index was developed by WebPageTest to calculate the amount of time it takes for the above the fold content to load for the user. This is meaningful because it provides us with a metric of the perceived speed of your website. If the above the fold content is loading fast then the user is happier. If it's slow then the user can become uninterested and leave. A good rule of thumb is to keep Speed Index to 1000, which translates to 1 second.
Bytes In is the amount of kilobytes it took to download the content of the page. The trend over the years shows that page sizes are increasing year after year. This is a problem because larger web pages take longer to load on mobile networks and the majority of traffic on the Internet comes from mobile devices. It can take several seconds for a mobile browser to receive the first byte on a mobile device and we only have 3 seconds to get the content to the user before up to 40% of them abandon the request. That's why it's best to keep the page size to 1000 kilobytes. You can achieve this by optimizing images, lazy loading content below the fold, concatenating and minifying CSS and Javascript files, and using other optimization techniques.
Another great tool is the frame by frame breakdown of how the website loaded using the Filmstrip View. This allows us to see the actual user's experience and identify what areas could improve in terms of loading the most important, above the fold content. The waterfall chart is also great in identifying what resources are taking the longest to load and in what order they are loading. Recently WebPageTest added a new feature called Cost which allows you to see how much it would cost to view a website on a mobile device in different countries. This feature helps to show the importance of keeping the page size low. There's even a free WebPageTest API you can use to incorporate in your testing through AJAX calls and responses. This allows you to send the synthetic data to the same database as your RUM data, and then display all the data to see how to improve a website. Contact Patrick Meenan for an API key.
The Need for Speed
I've noticed over the last couple of years that clients are always asking about performance, but they just don't know exactly what questions to ask or how to measure performance. It's black and white to them: either the website is fast or the website is slow. The companies and freelancers that stand out are those that have a performance SLA with standards and best practices and are transparent about the performance of their client's sites. It's never been easier to keep track of performance data using open source tools and dashboards like Nines Performance Tool. It allows you to see information via a small toolbar on a website or look at the data via a dashboard using Google charts. Whether you use a paid service or use an open source tool, just start testing today! Remember that #perfmatters!

About Matt Shull
Data Science Program Manager at Thinkful. Writes a lot about performance, Vue/Nuxt, and IoT. Loves tweeting and retweeting practical development advice.


