Toggle Element State with Google Chrome and Mozilla Firefox
It's much easier to debug CSS than JavaScript since there are many fewer interactions in CSS, and they are much easier emulate. Still, element state debugging isn't simple...until now. Google Chrome's WebInspector and Mozilla Firefox's Firebug have a really sweet feature I just discovered which allows the developer to apply element states for the sake of debugging.
Chrome's WebInspector
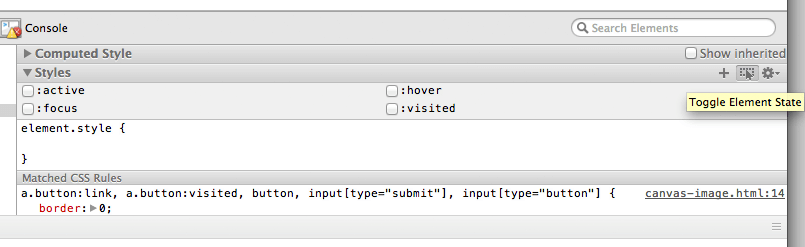
The image above displays Chrome's "Toggle Element State" button, allowing developers to toggle CSS states via checkboxes.
Firefox's Firebug
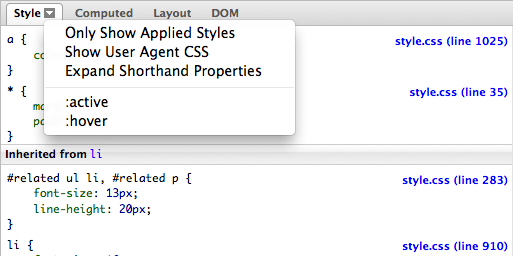
The image displays Firebug's likewise menu, triggered by the down arrow on the CSS tab for an element.
This allows active CSS state bugging vs. simple CSS explorations to be much, much easier. Happy CSS debugging!
![5 HTML5 APIs You Didn’t Know Existed]()
When you say or read "HTML5", you half expect exotic dancers and unicorns to walk into the room to the tune of "I'm Sexy and I Know It." Can you blame us though? We watched the fundamental APIs stagnate for so long that a basic feature...
![Facebook Open Graph META Tags]()
It's no secret that Facebook has become a major traffic driver for all types of websites. Nowadays even large corporations steer consumers toward their Facebook pages instead of the corporate websites directly. And of course there are Facebook "Like" and "Recommend" widgets on every website. One...
![Introducing MooTools LinkAlert]()
One of my favorite Firefox plugins is called LinkAlert. LinkAlert shows the user an icon when they hover over a special link, like a link to a Microsoft Word DOC or a PDF file. I love that warning because I hate the surprise...
![Creating Spacers with Flexbox]()
I was one of the biggest fans of flexbox before it hit but, due to being shuffled around at Mozilla, I never had the chance to use it in any practice project; thus, flexbox still seems like a bit of a mystery to me. This greatly...


Great tip, thanks =)
FireBug does this for years. Just click the little arrow next to the style tab. It’s only
:hoverand:active, though.Awesome, just added that as well.
The only thing Chrome cant do with states is when I need to debug an element that matches selector
parentElement:hover element, for exampleChrome applies states only to selected element in inspector and when you selected another element, selected state is applied to new element
Next challenge: Debug pseudo elements with web inspector :p
the Chrome web inspector already supports pseudo elements.
Under the Matched CSS rules is a Psuedo element
I believe the latest version of firebug does similar, but I’m not sure as I haven’t used it in ages
Unfortunately you can not select the pseudo element like any other DOM-Element. Technically this is perfectly valid since pseudo-elements are not part of the DOM but I often miss that feature. Pseudo-elements are harder to debug than necessary.
Good stuff, from what I know this has been around for a while already.
@JAN BECK – not that hard really, you just have to select the main element and scroll down in the inspector panel to see the psuedo elements
it’s also possible to do this with Firefox’ built in developer tools :-)